三角関数のサインとコサインは連続する滑らかなモーションに利用できます。
目次
サインとコサインと円
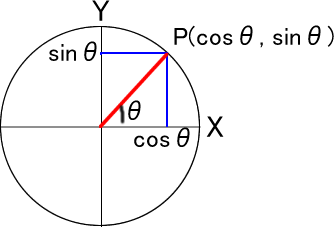
サイン(sin)とコサイン(cos)は、角度θに対する半径1の円周上の点が座標(cosθ, sinθ)にあることを言います。したがって点Pが(cosθ, sinθ)にあるとき、cosθはX軸上の0からcosθまでの長さに、sinθはY軸上の0からsinθまでの長さに当たります。

この円は半径が1なので、もっと大きくしたい場合はその半径を掛けます。また円の中心は原点(0, 0)なので、中心を移動したい場合には、それを足します。
// (centerX, centerY)を中心とする半径がradiusの円
// 円周上のx座標値
const x = centerX + cosValue * radius;
// 円周上のy座標値
const y = centerY + sinValue * radius;
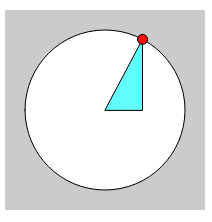
この計算により、角度θのときの(x, y)が分かるので、draw()関数内でθを増減させ、位置(cosθ, sinθ)にシェイプを描くと、円運動になります。
let angle = 0;
let centerX;
let centerY;
// 大きな円の半径
const radius = 80;
const speed = 0.01;

function setup() {
  createCanvas(200, 200);
  // キャンバスのセンターをメモ
  centerX = width / 2;
  centerY = height / 2;
}

function draw() {
  // angleのサイン値とコサイン値
  const sinValue = sin(angle);
  const cosValue = cos(angle);

  background(204);
  fill(255);
  ellipse(centerX, centerY, 160, 160);
  // 円周上のx座標値
  const x = centerX + cosValue * radius;
  // 円周上のy座標値
  const y = centerY + sinValue * radius;
  fill(100, 255, 255);
  triangle(centerX, centerY, x, y, x, centerY)

  fill(255, 0, 0);
  // 円周上を移動する赤い円を描画
  ellipse(x, y, 10, 10);
  // 角度を少しずつ大きくする
  angle += speed;
}
サイン波とコサイン波
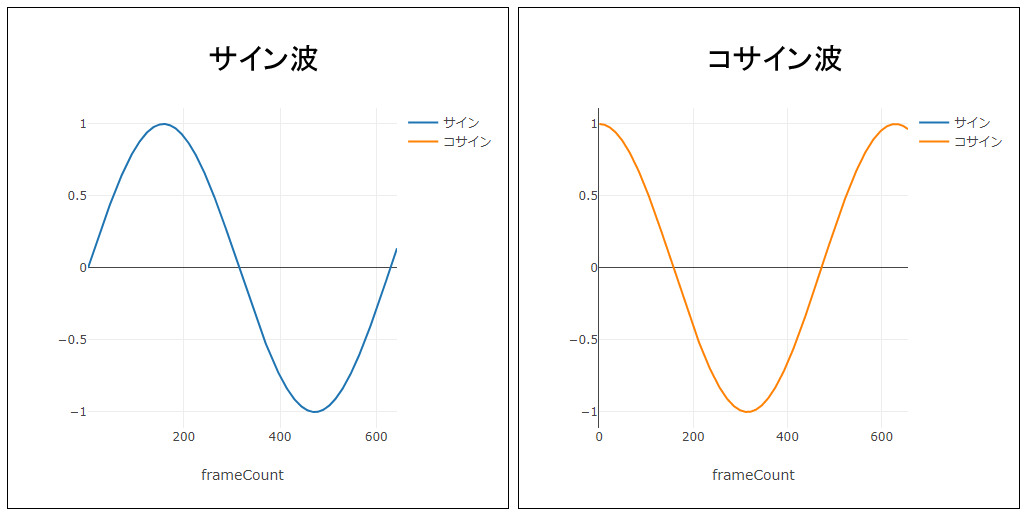
p5.jsのsin()とcos()関数が返す値を、次のコードでグラフにプロットすると、サイン波とコサイン波が描画できます(plotly.jsを使用)。
let angle = 0;
const speed = 0.01;

function draw() {
    // angleのサイン値とコサイン値
    const sinValue = sin(angle);
    const cosValue = cos(angle);

    plot(frameCount, sinValue);
    plot(frameCount, cosValue);
    angle += speed;
}
サイン波もコサイン波も、波のてっぺんと底近くで変化の度合いが緩くなり、その後向きを変えます。この曲がり具合が面白いモーションを生み出す元です。サイン波は0から始まるので、0から始めたいモーションに適していると言えます。

サイン波の動き
次の例は、sin(angle)が返すサイン値を動きに変換するうまい方法を示しています。
let angle = 0.0;
const offset = 60;
const scalar = 40;
const speed = 0.05;

function setup() {
    createCanvas(240, 120);
    strokeWeight(2);
    stroke(255);
}

function draw() {
    background(0);
    const y1 = offset + sin(angle) * scalar;
    const y2 = offset + sin(angle + 0.4) * scalar;
    const y3 = offset + sin(angle + 0.8) * scalar;
    fill(255, 0, 0);
    ellipse(80, y1, 40, 40);

    fill(0, 255, 0);
    ellipse(120, y2, 40, 40);

    fill(0, 0, 255);
    ellipse(160, y3, 40, 40);
    angle += speed;
}
うずまき
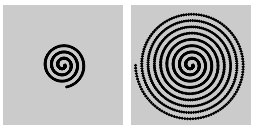
円の半径に当たるscalar値をフレームごとに大きくすると、うずまきになります。
let angle = 0.0;
const offset = 60;
let scalar = 2;
const speed = 0.05;

function setup() {
    createCanvas(120, 120);
    fill(0);
    background(204);
}

function draw() {
    const x = offset + cos(angle) * scalar;
    const y = offset + sin(angle) * scalar;
    ellipse(x, y, 2, 2);
    angle += speed;
    scalar += speed;
}
